

our continuing upward redistribution of wealth
- Written by: Christopher Sheil, Visiting Senior Fellow in History, UNSW
The results of the latest Australian Bureau of Statistics biennial survey of income and wealth met have met with an uneven response, perhaps in part due to a slipshod press release.
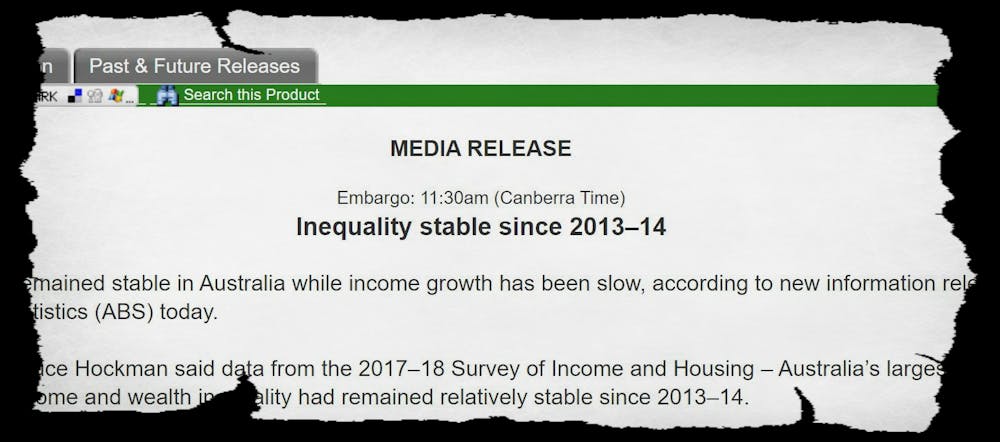
Released with the data on July 12, it was headed: “Inequality stable since 2013-14”.
 It began:
Income inequality has remained stable in Australia while income growth has been slow, according to new information released by the Australian Bureau of Statistics today.
Oddly, the press release didn’t include data to back up its conclusion. That was left for reporters and analysts to find, diving into the trove of more detailed information assembled by the bureau, from which a somewhat different picture emerged, particularly for wealth.
Writing for the ABC, Stephen Long and Michael Janda noted that average (mean) household wealth has been climbing quickly whereas typical (median) household wealth has not, implying that the rich are getting richer much more quickly than Australians in the middle.
Read more:
Inequality is growing, but it is also changing as Australia's super rich evolve
They also noted an increase in the so-called Gini coefficient, commonly used by the bureau and others to measure inequality.
And they noted that the “ultrawealthy” were probably under-counted in the survey, as is to be expected in essentially voluntary random surveys.
It began:
Income inequality has remained stable in Australia while income growth has been slow, according to new information released by the Australian Bureau of Statistics today.
Oddly, the press release didn’t include data to back up its conclusion. That was left for reporters and analysts to find, diving into the trove of more detailed information assembled by the bureau, from which a somewhat different picture emerged, particularly for wealth.
Writing for the ABC, Stephen Long and Michael Janda noted that average (mean) household wealth has been climbing quickly whereas typical (median) household wealth has not, implying that the rich are getting richer much more quickly than Australians in the middle.
Read more:
Inequality is growing, but it is also changing as Australia's super rich evolve
They also noted an increase in the so-called Gini coefficient, commonly used by the bureau and others to measure inequality.
And they noted that the “ultrawealthy” were probably under-counted in the survey, as is to be expected in essentially voluntary random surveys.
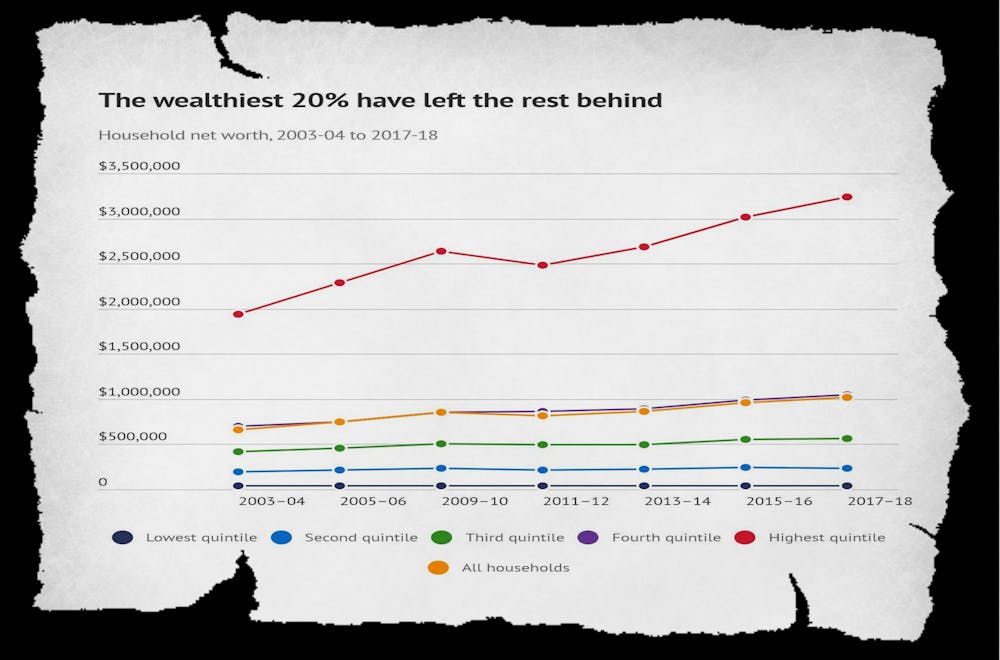
 In the Sydney Morning Herald and Age, Shane Wright and Eryk Bagshaw tracked the trends since 2003-04, when the bureau began its income and wealth survey.
Examining “quintiles” (which divide Australia’s households into five equally sized groups, in this case from least wealthy to most wealthy), they found an increasingly divided society.
Their captions read: “The wealthiest 20% have left the rest behind” and “The rich are getting richer”.
In the Sydney Morning Herald and Age, Shane Wright and Eryk Bagshaw tracked the trends since 2003-04, when the bureau began its income and wealth survey.
Examining “quintiles” (which divide Australia’s households into five equally sized groups, in this case from least wealthy to most wealthy), they found an increasingly divided society.
Their captions read: “The wealthiest 20% have left the rest behind” and “The rich are getting richer”.
 Both sets of journalists were right not to accept the bureau’s sunny headline.
According to the bureau’s own data, over the four years since 2013-14, the top 20% of households increased their share of the nation’s private wealth from 62.1% to 63.4%. Their share was 59% in the first survey back in 2003-04.
The wealth share of every other quintile fell.
The share of the second wealthiest quintile fell from 20.5% to 20.4%; the share of the middle quintile from 11.4% to 11.1%; the share of the second poorest quintile from 5.1% to 4.5%; and the share of the bottom quintile from 0.9% to 0.7%.
That is not a picture of stable inequality.
It is more reasonably described as a picture of gradually increasing inequality, of the kind we would expect given the underlying dynamics of modern Australian capitalism.
Unchecked, things will get worse
In the absence of deliberate redistribution, the inequalities associated with accumulated wealth tend to increase over time.
Unless actively restrained, the trends identified (but not publicised) by the bureau suggest that Australia will become increasingly unequal.
Yet there is more to the story than correctly describing the data presented.
There is also what’s missing. The survey does not present a figure for total household wealth. This means we don’t know how much wealth it didn’t find.
An increasing amount of wealth is missing…
We will get a good idea in about a year when the bureau reconciles its income and wealth survey with the Australian National Accounts.
Previous reconciliations suggest that wealth missed is growing.
The gap between wealth identified in the survey and the national accounts climbed from about 5% in 2013-14 to 8% in 2015-16. That 2015-16 figure amounts to A$626 billion, which is a lot of missing wealth – considerably more than the total wealth of the poorest 40% of households.
Read more:
Inequality in the OECD is at a record high – and society is suffering as a result
The discrepancies appear to be associated with understatements of the value of property assets, loans, shares, trusts, and other equities of the type mainly held by wealthy Australians.
…and the ultrawealthy are invisible
The bureau’s released data ignores the distribution of wealth at the very top.
The data is reported in quintiles (fifths) and percentiles a decile apart, but inequality is likely to be growing the fastest at the very top where the data isn’t reported.
The so-called P90/P10 ratio provides a clue. This is the ratio of the wealth of the households 10% from the top of the wealth distribution and the wealth of the households 10% from the bottom. In other words, it compares the quite rich with the quite poor.
Read more:
Don't believe what they say about inequality. Some of us are worse off
The latest survey shows that the wealth of a household 10% from the top is 71 times the wealth of a household 10% from the bottom, up from 52 times in 2013-14, and 45 times when the survey began back in 2003-04.
It means the gains of households at the halfway point of the top 20% have been bigger than those of the top 20% as a whole, suggesting increasing inequality within the top 20%, which is likely to more extreme within the top 1%.
We really need to know
Statistics are windows on change. Despite our criticisms, the bureau’s biennial income and wealth survey gives us the best view of inequality we’ve got, but large areas remain foggy.
In research for the Evatt Foundation, we have used data from the Bureau of Statistics, Organisation for Economic Co-operation and Development and national accounts to estimate that, for the first time in more than half a century, the richest 10% of households own more than half of Australia’s private wealth.
Read more:
There's a reason you're feeling no better off than 10 years ago. Here's what HILDA says about well-being
The Evatt Foundation’s results seem to stand up well, but governments should really be producing better data themselves.
Inequality and its harmful effects on economic output and stability are growing. We owe it to ourselves to find out by how much.
Both sets of journalists were right not to accept the bureau’s sunny headline.
According to the bureau’s own data, over the four years since 2013-14, the top 20% of households increased their share of the nation’s private wealth from 62.1% to 63.4%. Their share was 59% in the first survey back in 2003-04.
The wealth share of every other quintile fell.
The share of the second wealthiest quintile fell from 20.5% to 20.4%; the share of the middle quintile from 11.4% to 11.1%; the share of the second poorest quintile from 5.1% to 4.5%; and the share of the bottom quintile from 0.9% to 0.7%.
That is not a picture of stable inequality.
It is more reasonably described as a picture of gradually increasing inequality, of the kind we would expect given the underlying dynamics of modern Australian capitalism.
Unchecked, things will get worse
In the absence of deliberate redistribution, the inequalities associated with accumulated wealth tend to increase over time.
Unless actively restrained, the trends identified (but not publicised) by the bureau suggest that Australia will become increasingly unequal.
Yet there is more to the story than correctly describing the data presented.
There is also what’s missing. The survey does not present a figure for total household wealth. This means we don’t know how much wealth it didn’t find.
An increasing amount of wealth is missing…
We will get a good idea in about a year when the bureau reconciles its income and wealth survey with the Australian National Accounts.
Previous reconciliations suggest that wealth missed is growing.
The gap between wealth identified in the survey and the national accounts climbed from about 5% in 2013-14 to 8% in 2015-16. That 2015-16 figure amounts to A$626 billion, which is a lot of missing wealth – considerably more than the total wealth of the poorest 40% of households.
Read more:
Inequality in the OECD is at a record high – and society is suffering as a result
The discrepancies appear to be associated with understatements of the value of property assets, loans, shares, trusts, and other equities of the type mainly held by wealthy Australians.
…and the ultrawealthy are invisible
The bureau’s released data ignores the distribution of wealth at the very top.
The data is reported in quintiles (fifths) and percentiles a decile apart, but inequality is likely to be growing the fastest at the very top where the data isn’t reported.
The so-called P90/P10 ratio provides a clue. This is the ratio of the wealth of the households 10% from the top of the wealth distribution and the wealth of the households 10% from the bottom. In other words, it compares the quite rich with the quite poor.
Read more:
Don't believe what they say about inequality. Some of us are worse off
The latest survey shows that the wealth of a household 10% from the top is 71 times the wealth of a household 10% from the bottom, up from 52 times in 2013-14, and 45 times when the survey began back in 2003-04.
It means the gains of households at the halfway point of the top 20% have been bigger than those of the top 20% as a whole, suggesting increasing inequality within the top 20%, which is likely to more extreme within the top 1%.
We really need to know
Statistics are windows on change. Despite our criticisms, the bureau’s biennial income and wealth survey gives us the best view of inequality we’ve got, but large areas remain foggy.
In research for the Evatt Foundation, we have used data from the Bureau of Statistics, Organisation for Economic Co-operation and Development and national accounts to estimate that, for the first time in more than half a century, the richest 10% of households own more than half of Australia’s private wealth.
Read more:
There's a reason you're feeling no better off than 10 years ago. Here's what HILDA says about well-being
The Evatt Foundation’s results seem to stand up well, but governments should really be producing better data themselves.
Inequality and its harmful effects on economic output and stability are growing. We owe it to ourselves to find out by how much.
Authors: Christopher Sheil, Visiting Senior Fellow in History, UNSW


 Daily Bulletin


