

Census 2016 reveals Australia is becoming much more diverse – but can we trust the data?
- Written by: Nicholas Biddle, Associate Professor, ANU College of Arts and Social Sciences, Australian National University
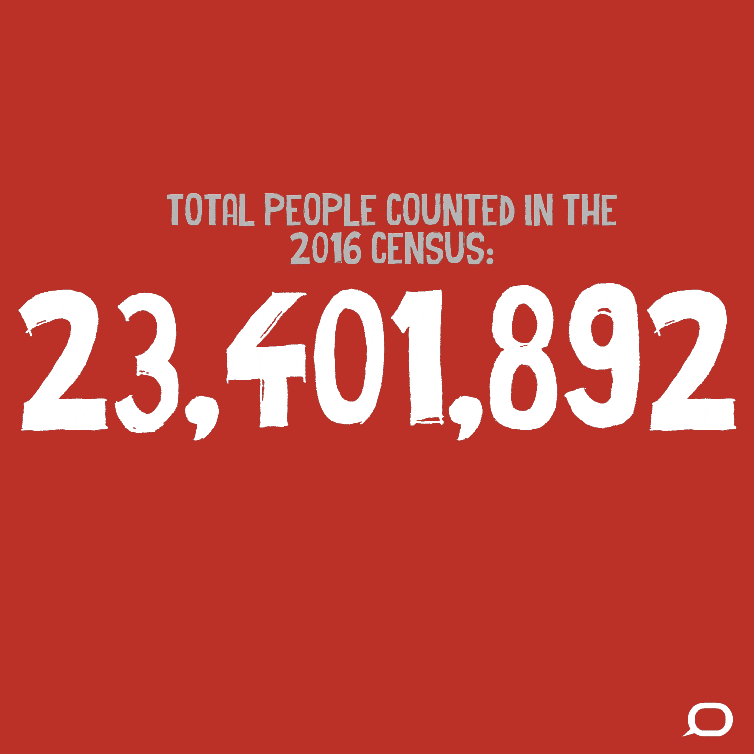
According to data released today, there were 23,401,892 people who were counted in Australia on the night of the 2016 Census who were usually resident in Australia.
After adjusting for undercount and adding back those who were overseas on census night, the Australian Bureau of Statistics (ABS) estimates that as of December 2016, Australia’s population was around 24.4 million.
Our population is growing – and fast. But can we trust the numbers?
Issues with quality
For the first time, the ABS asked an independent assurance panel to look into the census’ quality. While this was prompted by the failure of the online portal on census night, and the privacy concerns expressed by many, the additional scrutiny is a good idea.
The panel reported that the 2016 Census is “of comparable quality to 2006 and 2011 and comparable collections internationally”. It reported there was a lower net undercount (that is, people who were missed from the census) in 2016 than there was for 2006 and 2011.
This means, for the most part, we should believe the results from the 2016 Census. All data has its limitations. But it would appear that with the information we currently have the data is robust enough, at least at the national level.
But, as always, the devil is in the detail. For some individual questions, there was a high level of non-response – and that needs to be taken into account.
How we’re changing
The data tell us quite a lot about who we are as a nation, and how our characteristics are changing. The 2016 Census reveals that Australia is becoming much more diverse – in language, country of birth, Indigenous status, and religion.
In the 2011 Census, 69.8% of people reported being born in Australia. This declined over the past five years to 66.7%.
The percentage of Australia’s current population who were born in England has also declined, from 4.2% to 3.9%. Simultaneously, there was a dramatic increase in the percentage born in China – 1.5% to 2.2% – and born in India – 1.4% to 1.9%.
This increase has been driven in part by the higher rate of mortality of the Australian- and European-born populations, who are much older than more recent migrant groups. More importantly, though, most of our more recent arrivals are from Asia. Combined, those born in India, China and the Philippines made up 33% of all those who now live in Australia who arrived between 2007 and 2016.
Australia’s Indigenous population is also growing – quite rapidly.
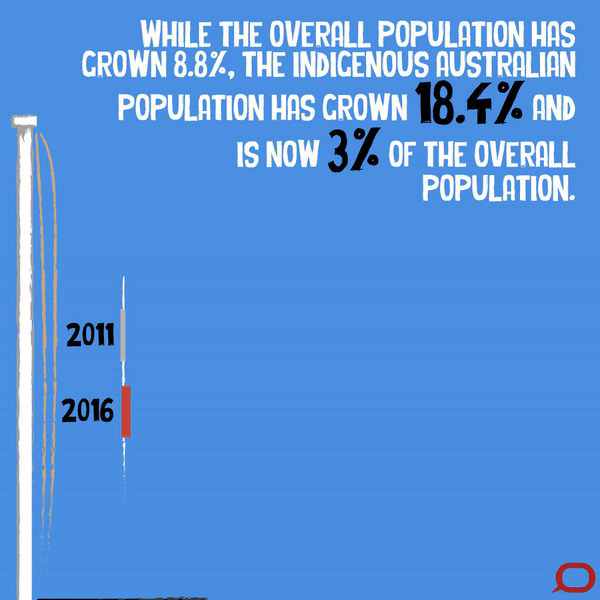
In 2016, there were 649,171 usual residents who were identified as being Aboriginal and Torres Strait Islander. For those who answered the question, this represents an increase from 2.7% to 3% of the total Australian population.
When undercount is adjusted for, the ABS estimates that 786,689 Aboriginal and Torres Strait Islander peoples should have been counted in the census. This is a growth of 18.8%, concentrated mainly in New South Wales and Queensland, and is much faster than the growth of the non-Indigenous population.
There was also a decline in the proportion of people who spoke English as their main language at home (76.8% in 2011 to 72.7% in 2016), an increase in those reporting no religion (21.8% to 29.6%), and a very rapid increase in the number of same-sex couples (a 39% increase to 46,800 couples).
One result that needs to be treated with care is the high and increasing rate of non-responses recorded to some of these questions. There were 1,622,692 people recorded as “not stated” for the country-of-birth question, and 1,411,491 who were recorded as not stated for the Indigenous status question. This was an increase of 35.7% and 33.3% respectively from 2011, which was much faster than the growth of the total population.
That doesn’t mean that all or even most of these records are people refusing to answer the question. Rather, most are records that have been imputed due to missed households or individuals.

However, we do need to make sure we carefully exclude these records from our calculations. And more research is needed to uncover whether and why there are a number of people not answering individual items.
Implications for policy
Leaving these issues aside, there were some interesting findings that touch on ongoing policy debates.
The Gonski 2.0 school funding reforms passed parliament last week. But there was actually a decline in the proportion of infants/primary school students who were attending a non-government school since the last census, from 32.7% to 31.8% between 2011 and 2016.
There was a slight increase in the proportion for secondary school students (42.1% to 42.8% in non-government schools). This means the proportion across all schools was roughly stable (36.5% in 2016 compared to 36.7% in 2011).
There is more to the school funding debate than simply government versus non-government. But the census results show the move to the non-government sector seen over previous periods may have slowed, or even reversed.
Another important current policy debate relates to the National Disability Insurance Scheme (NDIS). While the census isn’t ideal for understanding changes in rates of disability, there is a very important question about whether people have a “core activity need for assistance”.
One particular result stands out – the rapid increase in the number of children and youth reported to have such a need. Between 2011 and 2016, the proportion of those aged 19 years or under reported as having a core activity need for assistance increased from 2.1% to 2.7%, excluding the not-stated population.
These proportions might not seem large. But it is an extra 38,209 individuals, or a 34.5% increase in children and youth with a core activity need for assistance.
Finally, even if the policy responses weren’t large, the most recent federal budget and election both had a heavy focus on housing affordability and home ownership. The census doesn’t have information on house prices, but it does show that the median mortgage payment in Australia in 2016 was A$1,755 per month. Sydney, Darwin and Canberra all have median payments of $2,000 or more.
Over the longer term, the proportion of the Australian population who own their home outright (that is, without a mortgage) has declined from 41.1% in 1991 to 31% in 2016. Much of that decline has been made up for by an increase in the proportion renting (either from government or a private landlord) from 26.9% to 30.9% over the same period.
These are just a snapshot of 2016 Census results. For the most part, we can be confident that, in the words of the Australian Statistician David Kalisch:
The 2016 Census data provides a detailed, accurate and fascinating picture of Australia and our communities.
For individual data items, we need to be more careful and circumspect. But we now have a much better idea on our nation and how it is travelling.
Authors: Nicholas Biddle, Associate Professor, ANU College of Arts and Social Sciences, Australian National University


