

Explaining Australia's school funding debate: what's at stake
- Written by: Peter Goss, School Education Program Director, Grattan Institute
Estimating how much parents can afford to pay towards their children’s schooling is both vital and politically sensitive. Non-government schools with well-off parents get much less funding from government.
One element of how government estimates this, the school’s SES or socio-economic score, was recently reviewed by the National School Resourcing Board (NSRB), established by the Australian government as part of last year’s Gonski 2.0 funding legislation.
Read more: Gonski 2.0: Is this the school funding plan we have been looking for? Finally, yes
In a nutshell, the NSRB recommended that a direct measure based on pre-tax income is a fairer way to estimate how much non-government school families can contribute to school fees than the current approach, which is based on where families live. The board also showed how smart use of existing data can do this without compromising privacy or forcing schools to collect parents’ tax file numbers.
Here’s why its analysis should prevail, despite strident opposition from some Catholic education leaders, and the claim from the independent schools’ peak body that the current methodology is appropriate.
How funding works today
Under both Labor and Coalition versions of Gonski, the funding target for each school is made up of two components:
Base funding: an amount for each student, discounted for non-government schools according to how much parents can afford to pay, known as their “capacity to contribute”
Needs-based loadings: an additional amount for each student with higher needs, regardless of their parents’ capacity to contribute.
For most non-government schools, their government funding primarily depends on how much their per-student base funding is discounted.
The discount is determined by the school’s SES score. Schools with well-off parents have higher SES scores and received lower base funding per student; schools with less-well-off parents have lower SES scores, and receive more. The average SES score is 100, and 97% of scores fall between 85 and 125.
SES scores are calculated every five years using census data about the average income, education and occupation level in the area where each family lives. This was the best approach available when it was introduced. But families in a given area are not all the same. It would be better to measure family income or wealth directly.
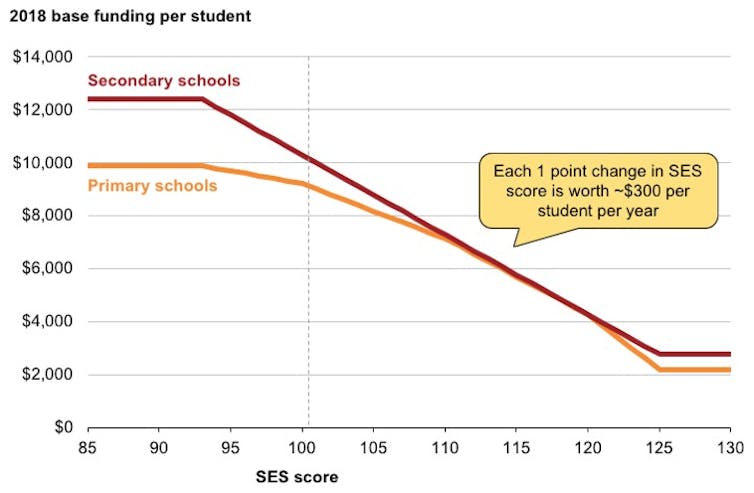 Base funding for non-government schools depends on each school’s SES score. Australian Education Act (2013)
This chart shows why the accuracy of the SES score is so important – small changes matter. Reducing a moderately advantaged school’s SES score by just a single point would increase its government funding by about A$300 for every student every year.
If the SES score of every Catholic school dropped by one point, total Catholic funding would be boosted by about A$90 million in 2018, a 1% increase on current government funding. Lifting the SES score of every independent school by one point would reduce their aggregate government funding by about A$100 million, or roughly 2%.
History matters
A quirk of history helps explain why the SES score methodology is so contentious.
Many non-government schools in Australia - mainly Catholic schools, but also Anglican, Lutheran or some other religious denomination - are part of school systems. These systems receive their government funding in a lump sum, then redistribute it according to their own view of need.
Up until 2017, school systems could choose to be funded according to the average SES score of all their schools, called the system-weighted average. Because the base funding discount formula shown in the chart above is not linear, systems using this approach typically received more government funding.
The biggest beneficiaries of this approach were high-SES Catholic primary schools.
Read more: Catholic schools aren't all the same, and Gonski 2.0 reflects this
Because they were funded as average rather than high-SES schools, they were able to charge dramatically lower fees than independent schools with similarly advantaged parents. This fitted with the Catholic philosophy of keeping primary school fees low, regardless of ability to pay.
Why the SES score needed to be reviewed
In 2017, Education Minister Simon Birmingham removed the system-weighted average as part of his Gonski 2.0 funding reform. This change alone reduced projected Australian government funding to Catholic schools by several billion dollars over a decade, out of a projected A$90 billion or so.
Catholic school leaders were not happy, arguing that the SES score formula is not just inaccurate but systematically biased against Catholic schools. Catholic advocacy was so strident in Victoria’s recent Batman by-election that it grabbed the attention of the Australian Charities and Not-for-Profits Commission.
High SES Catholic schools lost the most – precisely because they benefited most from the distortions of the previous model. That’s why media scare stories about fee increases focused on parish primary schools in leafy green suburbs, not battlers in outer-suburban Catholic schools. Indeed, many low-SES Catholic schools are better off under Gonski 2.0.
But analysis of “winners” and “losers” is not the point. Removing the system-weighted average meant it was necessary to review the SES score formula, which had known flaws.
The job of reviewing the SES score was given to the newly-formed NSRB, which asked for public submissions. I made two main recommendations in my submission:
First, the review needed to clarify the policy goal of the capacity-to-contribute element of the funding formula and make it explicit.
Second, the review needed to confirm - or refute - whether the SES score is biased against Catholic schools, and to propose a way to remove bias if it exists.
Clarifying the goal of capacity to contribute
The NSRB report clarified the goal of capacity to contribute via three active choices.
It defined capacity to contribute as “a function of the school community’s income and wealth”. So it rejected proposals by Catholic school leaders and others that an updated SES score should take school fees into account. Capacity to contribute is not the same as willingness to pay.
It defined the school community as “the parents and guardians of the students at a school”, so ruled out trying to capture contributions from extended families.
Finally, the NSRB articulated an over-arching principle about funding for non-government schools (p7):
…non-government school communities with the same capacity to contribute should attract the same level of government support.
This clearly rejects the idea that government funding should be higher simply because a school charges low fees. It is also incompatible with the system-weighted average approach.
Not as accurate as a direct measure, but only moderately biased against Catholic schools
The harder job for the NSRB was to delve into the statistical properties of the SES score and what might replace it.
Even with the most fine-grained census data, using small statistical areas of about 400 people, the area-based approach is less accurate than directly measuring each families’ capacity to contribute.
The board analysed how much schools’ SES scores would change if their parents’ income was measured directly. It found little difference for many schools (in some cases part because the school already receives the minimum or maximum funding discount), a big difference for a few, but only moderate bias against Catholic schools.
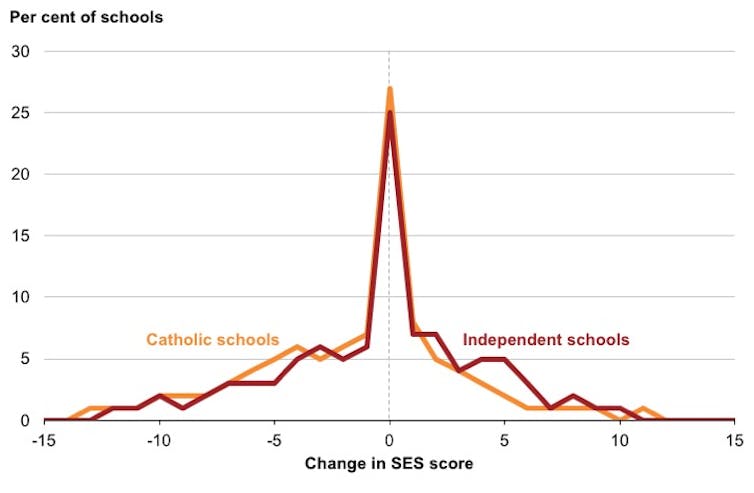 Change in score based on the comparison of the median household income score and current SES score by sector. Schools that do not change their effective score (because base funding discount rates are capped at 93 and 125) are given a value of 0.
Adapted from Exhibit 21 on page 37 of the Review of the socio-economic status score methodology: final report.
Change in score based on the comparison of the median household income score and current SES score by sector. Schools that do not change their effective score (because base funding discount rates are capped at 93 and 125) are given a value of 0.
Adapted from Exhibit 21 on page 37 of the Review of the socio-economic status score methodology: final report.
While most schools would see their effective SES score change by less than three points, nearly one in four schools would change by six or more points, which translates to nearly A$2,000 per student per year.
The area-based approach turns out to be less biased than many thought:
- independent schools are equally likely to see their effective score go up or down; while
- for every eight Catholic schools with scores that go down, five schools have scores that go up.
On average, Catholic school SES scores drop by 1.3 points under a direct model, while independent school SES scores drop by 0.4 points. The size of the bias appears to be about one point.
What is the likely funding impact of moving to a direct measure of income?
The most accurate way to calculate the likely impact on funding for the independent and Catholic school sectors is to model the specific change in SES score for each school. At this stage, only the NSRB’s analysts have the data to do that, and the NSRB did not include that analysis in their report.
However, it is possible to make some educated guesses. I used the chart above to simulate what happens if most schools see little or no change in SES scores while a few schools see bigger changes. I made further refinements to acknowledge that the bias in the current system seems to be largest for high-SES schools, and it may be even larger for big, rich independent schools.
Across a range of scenarios, using a direct measure increases Catholic schools funding by somewhere from A$50 million to A$150 million a year. Independent schools funding is harder to predict, ranging from a decrease of A$100 million or more to even a slight increase in funding. But the independent schools that need the money most will do better under this model than the previous one.
These are big dollars, but still only about 1 or 2% of Australian government funding for each sector.
To put it in context for Catholic schools, the flaws in the current SES score are much smaller than their historic benefit from using a system-weighted average, which would be worth more than A$300 million if re-instated in 2018.
What next?
The NSRB itself has indicated that further work is needed before moving to a direct measure of capacity to contribute. But it has pointed the way with sensible analysis that addresses a range of concerns.
The decision to focus on income is pragmatic. While capacity to contribute is a function of both wealth and income, wealth is harder to measure, for now at least.
The volatility of income data is addressed by using a three-year rolling average. Using the median income further reduces uncertainty for schools, since the median is less affected than the mean if a parent loses their income, or a rich new family joins the school.
Privacy is dealt with by using a new government data-matching approach. Rather than schools having to ask parents for tax file numbers, existing parental address data is passed to the Australian Tax Office, which already has all our income data.
Tax minimisation is dealt with by use of total income rather than taxable income. Independent school leaders are citing supposed counter-examples, like farmers, where total income exaggerates a family’s capacity to contribute. But the use of median income (rather than mean income) minimises this impact.
Including family size strengthens the model further, since a family with multiple children has a lower ability to pay each child’s school fees than a single-child family.
Catholic complaints don’t pass the pub test
Given that Catholic demands to review the SES score have been met, and the answer will mean a little more money for Catholic schools, will the Catholic education leadership be satisfied? While the National Catholic Education Commission has cautiously welcomed the report, other Catholic leaders are less sanguine.
The key battleground is the Catholic desire for high-fee schools to receive less government funding, by including fee income in the way SES scores are calculated.
If the board is right that the key principle is how much parents can afford, then fees charged are irrelevant.
A dissenting view, written by the Catholic representative on the NSRB, is that excluding school fees “doesn’t pass the pub test”. This view focused on schools that charge particularly high fees, most of which are independent schools. But in fact these schools will have high SES scores anyway under a direct measure of parental income, and will receive minimum Commonwealth funding.
The hard question - not addressed in the dissenting view - is why high-SES Catholic schools should get more funding just because they charge lower fees, even when parents could afford to pay more. For example, as the NSRB report shows, there are 10 or so Catholic primary schools where median household incomes are at least A$300,000, but fees are less than A$5,000.
If Catholic leaders want to dispute the NRSB’s principle that “non-government school communities with the same capacity to contribute should attract the same level of government support” they should make that case explicitly.
Views at the pub might differ on that one.
Overall, we are making real progress on school funding. We have a system that funds according to need. The NSRB’s recommended approach is more accurately tied to the ability to pay than the current system. Our school funding model will never be perfect. But it’s getting better.
Authors: Peter Goss, School Education Program Director, Grattan Institute
Read more http://theconversation.com/explaining-australias-school-funding-debate-whats-at-stake-100023


 Daily Bulletin


